
Where is my memory going in Ubuntu 14.04?
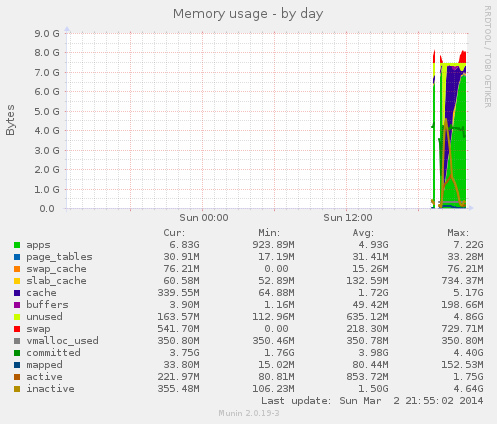
I'm running Ubuntu Trusty 14.04 on a new machine with 8GB of RAM, and it seems to be locking up periodically and spewing "Kill process 21500 (python) score 1 or sacrifice child" errors with lots of different processes (there are 182 such messages in syslog from today). I've installed Munin and have been watching the graphs, and it looks like the "apps" memory is going through the roof...
http://
free agrees, claiming I'm using more than 7G of memory:
# free -h
Mem: 7.5G 7.3G 162M 147M 1.7M 282M
-/+ buffers/cache: 7.1G 446M
Swap: 15G 571M 14G
However, I'm having trouble determining what exactly is eating all of that memory. Running top or htop doesn't seem to single anything out, and ps_mem.py (https:/
...
8.3 MiB + 279.5 KiB = 8.6 MiB Plex Media Server
9.8 MiB + 312.0 KiB = 10.1 MiB Xorg
13.7 MiB + 233.0 KiB = 13.9 MiB transmission-daemon
12.6 MiB + 1.7 MiB = 14.4 MiB compiz
68.5 MiB + 1.3 MiB = 69.8 MiB python (4)
96.2 MiB + 2.6 MiB = 98.9 MiB plexhometheater (2)
---
===
This other formula for totaling the memory roughly agrees:
# ps -e -orss=,args= | sort -b -k1,1n | awk '{total = total + $1}END{print total}'
318460
If the processes only total 292-318 MiB, where's the rest of the memory going?
Slabtop doesn't look like I have a huge cache or anything...
Active / Total Objects (% used) : 249458 / 272022 (91.7%)
Active / Total Slabs (% used) : 9901 / 9901 (100.0%)
Active / Total Caches (% used) : 77 / 105 (73.3%)
Active / Total Size (% used) : 53500.41K / 60447.70K (88.5%)
Minimum / Average / Maximum Object : 0.01K / 0.22K / 8.00K
OBJS ACTIVE USE OBJ SIZE SLABS OBJ/SLAB CACHE SIZE NAME
41496 40465 97% 0.15K 1596 26 6384K btrfs_extent_map
31752 29947 94% 0.19K 1512 21 6048K kmalloc-192
28800 24573 85% 0.06K 450 64 1800K kmalloc-64
25740 25740 100% 0.11K 715 36 2860K sysfs_dir_cache
24843 19234 77% 0.19K 1183 21 4732K dentry
I'm running Trusty and not Saucy because I'm using btrfs, and wanted as fresh a kernel as possible.
What other tests can I do to understand my memory usage? Thanks!
Question information
- Language:
- English Edit question
- Status:
- Solved
- For:
- Ubuntu Edit question
- Assignee:
- No assignee Edit question
- Solved by:
- Aneel Nazareth
- Solved:
- Last query:
- Last reply:
